


The NASA PACE (Plankton Aerosol and Ocean Ecosystems) satellite, launched on February 8, 2024, has three science instruments: (i) Ocean Color Instrument (OCI), (ii) Hyper-Angular Rainbow Polarimeter 2 (HARP2) and (iii) SPEXone multi-angle spectrometer. The PACE mission has a minimum duration of three years, with orbit maintenance capabilities for 10 years.
SPEXone is a compact multi-angle channeled spectropolarimeter with five viewing angles and hyperspectral imaging of a ~100 km swath with a spatial resolution of 4.6 x 5.4 km in the along track and across-track directions and a spatial oversampling ratio of 2. SPEXone has a spectral range from 385 to 770 nm and a spectral resolution slightly below 2 nm. High accuracy polarimetry is achieved by implementation of the dual-beam snapshot spectral polarization modulation concept, yielding two complementary spectrally modulated hyperspectral images of the same scene from which both radiance and state of linear polarization can be extracted.
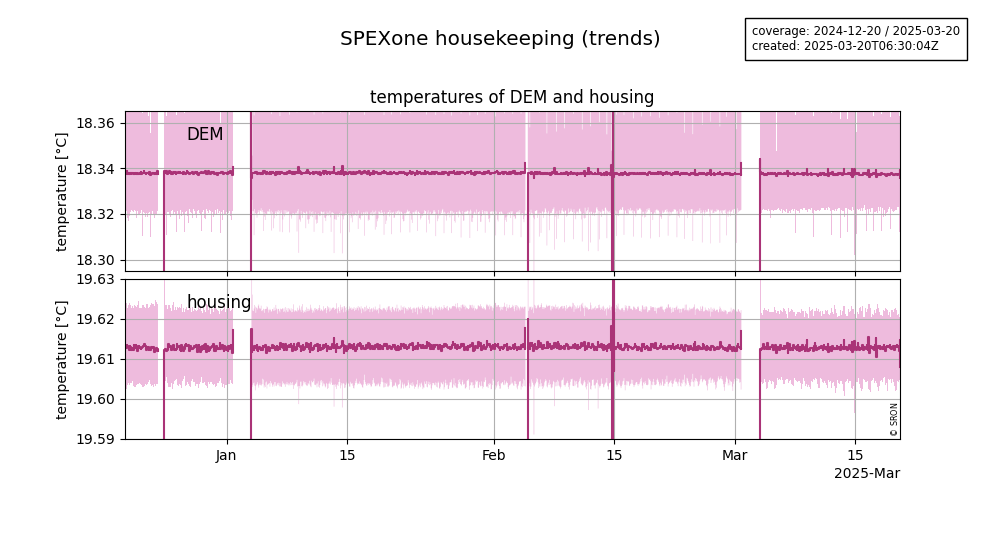
The automated in-flight monitoring of the SPEXone instrument include in-orbit stability of the thermal subsystem, the optics, and the detector. The results of the in-flight monitoring are presented in separate tabs.
The relevant housekeeping parameters for stability of the SPEXone instrument are listed in the Table below. The reports of these parameters are generated from PACE HKT products. These products contain the instrument telemetry sampled at 1 Hz, which are averaged over 30 seconds for the daily plots and averaged over a full orbit in the trend plots. The mean value is shown as a purple line and the range between the minimum and maximum as a grey band.s.
| Description | Units | Nominal | Lower limit | Upper limit |
| TS1_DEM_N_T | C | 18.33 | 18.25 | 18.41 |
| TS2_HOUSING_N_T | C | 19.61 | 19.55 | 19.67 |
| TS3_RADIATOR_N_T | C | 0.5 | -1.9 | 1.6 |
| TS4_DEM_R_T | C | 17.9 | 17.65 | 18.0 |
| TS5_HOUSING_R_T | C | 19.3 | 19.05 | 19.55 |
| TS6_RADIATOR_R_T | C | 0.6 | -1.9 | 1.6 |
| Heater 2 power | W | 3.5 | 3 | 4.5 |
| Heater 3 power | W | 4.25 | 3.5 | 4.5 (7) |
| Detector temperature | C | 21 | 19 | 22 |
| ICU DIGV | C | 32 | 31 | 33 |
| ICU heater-group 1 | C | 46 | 45 | 47 |
| ICU heater-group 2 | C | 43 | 42 | 44 |
| ICU MCU-RAM | C | 34 | 33 | 35 |
| ICU midboard | C | 33.5 | 32.5 | 34 |
| DEM supply | mA | 495 | 430 | 510 |
| ICU 1.2V bus | mA | 167.5 | 165 | 170 |
| ICU 3.3V bus | mA | 175 | 165 | 190 |
| ICU 4V bus | mA | 210 | 200 | 235 |
| ICU 5V bus | mA | 485 | 435 | 500 |
| DEM supply | V | 4.77 | 4.76 | 4.81 |
| ICU 1.2V bus | V | 1.245 | – | – |
| ICU 3.3V bus | V | 3.269 | 3.268 | 3.270 |
| ICU 4V bus | V | 3.905 | 3.89 | 3.915 |
| ICU 5V bus | V | 4.855 | 4.845 | 4.88 |
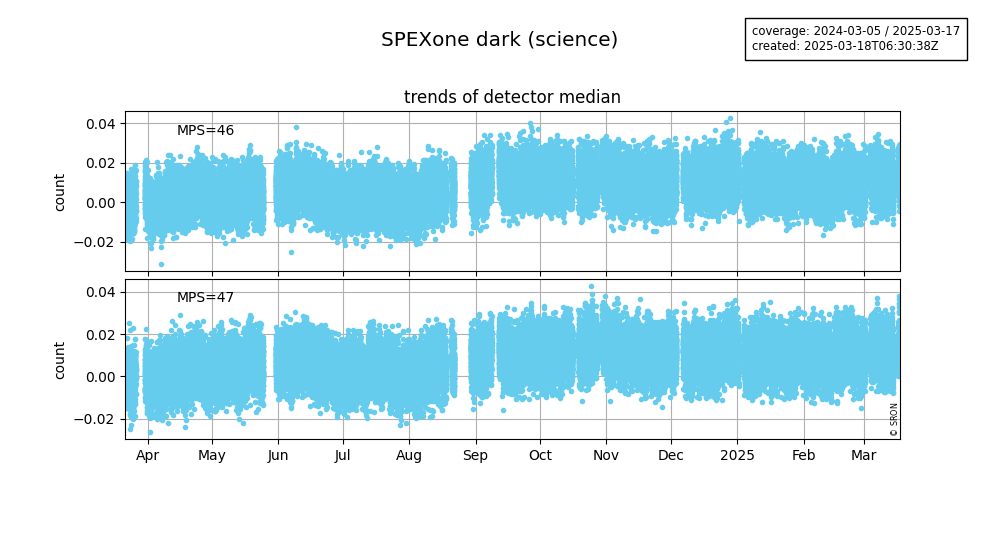
Dark measurements are performed during eclipse, mostly outside the South Atlantic Anomaly (SAA), with the detector in Diagnostic mode (full-frame) and Science mode (binned). For the stability analysis, all measurements performed during one day are averaged and the unbiased standard deviation (uncertainty) is determined. In the trend plots, the detector average are shown as a function of time. The relevant instrument settings are listed below. The results of the dark algorithm are also used in pixel-quality analysis.
| MPS ID | Mode | Texp [ms] | Co-additions | Repetitions |
| 46 | Science | 60 | 5 | 28 |
| 47 | Science | 64 | 5 | 28 |
| 132 | Diagnostic | 0.4 | 32 | 4 |
| 162 | Diagnostic | 60 | 32 | 4 |
| 163 | Diagnostic | 64 | 32 | 4 |
| 187 | Diagnostic | 6000 | 16 | 2 |
| MPS ID | Mode | Texp [ms] | Co-additions | Repetitions |
| 46 | Science | 60 | 5 | 28 |
| 47 | Science | 64 | 5 | 28 |
The DoLP (degree of linear polarization) of certain pixels is collected and compared with a theoretically calculated DoLP. This is done for cloud-free glint pixels with a solar zenith angle of 50 degrees or more. For these pixels the measured DoLP is collected and the DoLP is calculated with an algorithm which uses the scattering angle and the sensor/solar zenith and azimuth angles. Then the true DoLP is divided by the calculated DoLP and the mean and median of this fraction is taken each month. These monthly values are plotted. A separate plot is made for each viewport and each plot has a separate line for each chosen wavelength.
A selection of the smallest DoLP (degree of linear polarization) measurements is collected for the verification over bright clouds (cloud optical thickness > 30) and a scattering angle between 160 and 180 degrees. In these cases, it is expected that the DoLP is near-zero (within 0.001). From the pixels that pass the requirements the mean and median value of the smallest 1% of DoLP values is taken. The mean and median are shown as a monthly average. A separate plot is made for each viewport and each plot has a separate line for each chosen wavelength.
The non-nadir radiance measured by SPEXone over deep convective clouds (DCCs) is collected and compared to the nadir radiance. The definition of DCCs is given in the table below. As such the Iviewport/Inadir is calculated where Iviewport is the radiance of a non-nadir viewport (-50, -20, 20, 50 degrees) and Inadir is the radiance of the nadir viewport (0 degrees). The monthly mean Iviewport/Inadir
value is plotted. A separate plot is made for each viewport and each plot has a separate line for each chosen wavelength. Besides the measured Iviewport/Inadir, these two values are also theoretically calculated using a radiative transfer (RT) calculation. These values are also averages over a month and thus allow a comparison of the measured Iviewport/Inadir mean and the RT-based calculated
Iviewport/Inadir mean.
| Criteria for DCC | Characteristics | Motivation |
| Reflectivity at 750 nm > 0.7 | Top-of-atmosphere (TOA) signal is dominated by cloud |
TOA signal can be well predicted |
| Inter-tropical locations | Favorable areas for convection | Convective cloud |
| Measurements over ocean |
Negligible surface contribution (outside glint) |
Cloud signal dominates TOA signal |
| Cloud top height > 10 km | Negligible contribution from aerosols |
Cloud signal dominates TOA signal |
| RMS of radiance at 770 nm < 3% (from OCI) |
Homogeneous area | 1D RT calculation is sufficient |
| Solar zenith angle < 30 degrees |
Minimize shadow effects | 1D RT calculation is sufficient |
The radiance measured by the SPEXone instrument is compared to the radiance measured by the OCI instrument. This is done for specific regions, listed in the table below. Only pixels with a solar zenith angle below 60 degrees and a homogeneous cloud-region of 50×50 km2 are chosen. For the pixels passing these requirements and the region-specific requirements the radiance is taken from both instruments and the SPEXone radiance is divided by the OCI instrument. A monthly mean is
taken of this fraction and is shown in the plots. A separate plot is made for each region and each plot has a separate line for each chosen wavelength.
| Region id | General location | Latitude range | Longitude range | Requirements |
| 0 | Pacific Ocean | TBD | TBD | • Clear sky |
| 1 | Pacific Ocean | TBD | TBD | • Fully cloudy • Cloud optical thickness > 10 |
| 2 | Sahara Desert | TBD | TBD | • Clear sky |
| 3 | Antarctica | TBD | TBD | • Clear sky |
| 4 | Railroad Valley | TBD | TBD | • Clear sky |
The radiance measured by the SPEXone instrument is collected for specific regions where this radiance is expected to be relatively stable. The exact coordinates of the center points of these regions and the extent of these regions is TBD. Two different analyses are done: one for all (near-)cloud-free pixels and one for all (near-)cloud-filled pixels. Glint pixels are excluded from this analysis. The mean and median radiance are plotted as a monthly average. A separate plot is made for each region and viewport and each plot has a separate line for each chosen wavelength.